TL;DR
RICE measures impact-per-effort. WSJF focuses on urgency-weighted value for prioritization.
We use RICE for team backlogs when we can measure reach and impact. We choose WSJF for portfolio scheduling when time windows or risk reduction matter.
We set one time window for all items in a batch. Inputs stay simple—usually just integers.
Short rules and guardrails help us with privacy, accessibility, and ethical growth. We re-score items when certain triggers happen.
Key definitions (one line each)
RICE calculates value per effort: Reach × Impact × Confidence ÷ Effort.
WSJF determines priority by dividing Cost of Delay by Job Size for time-sensitive work.
Cost of Delay combines Business Value, Time Criticality, and Risk Reduction, each on a 1-10 scale.
Job Size measures build effort, often in person-months or story points.
Priority frameworks help teams pick what work delivers the most value first.
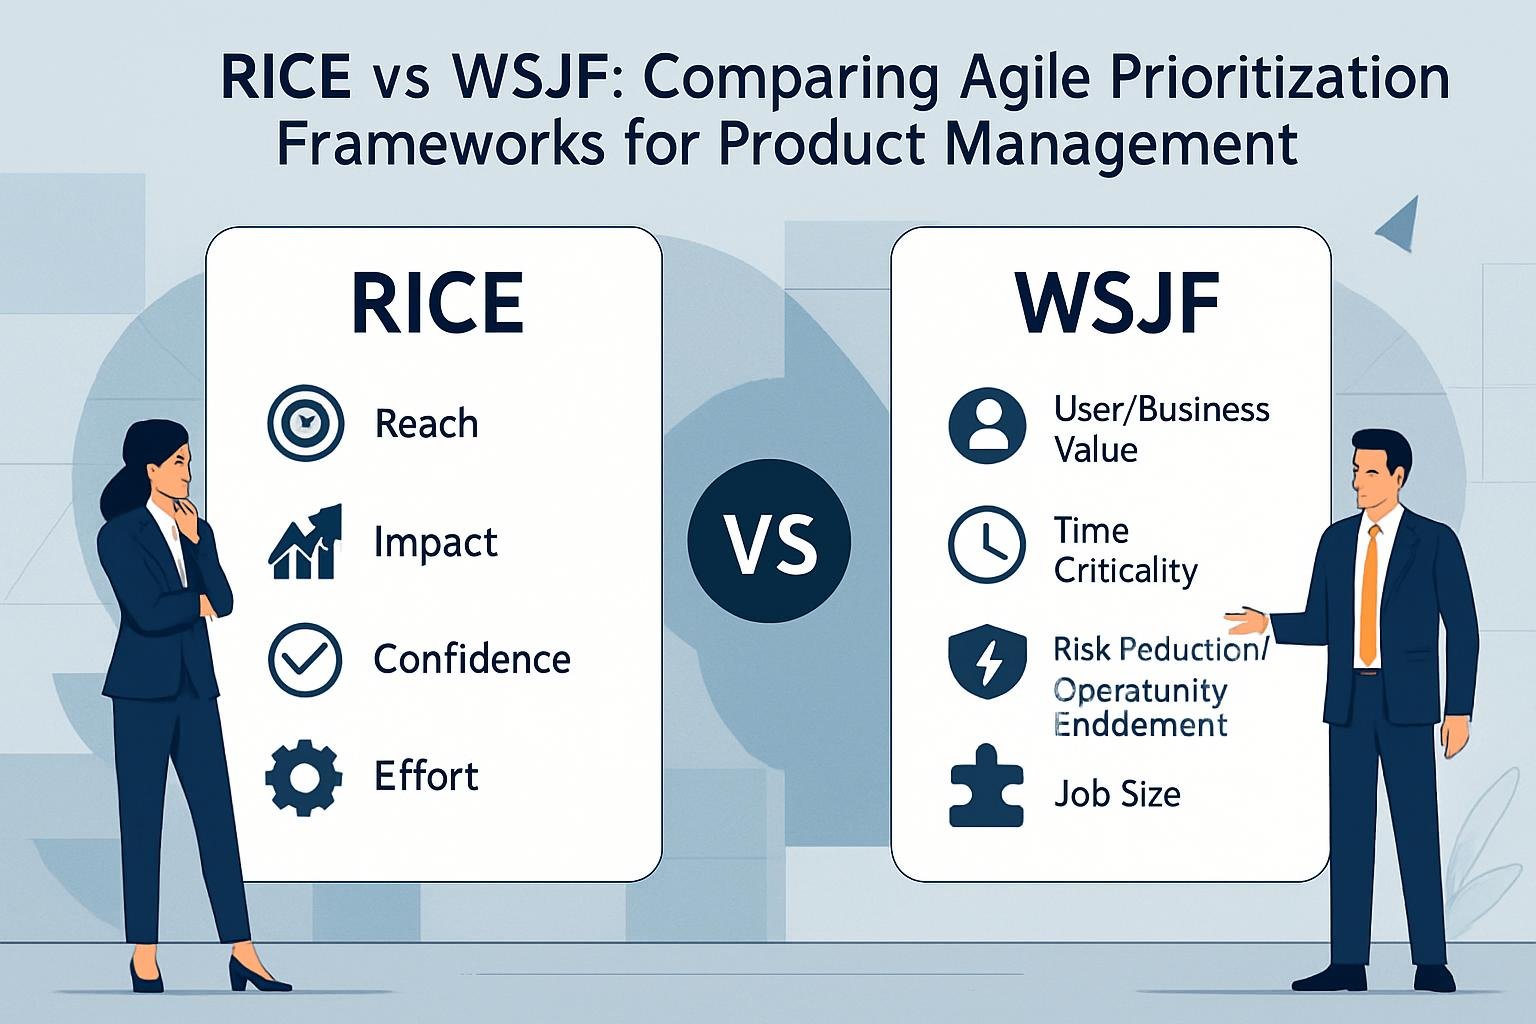
RICE vs WSJF at a glance
The RICE scoring model and weighted shortest job first tackle different questions. RICE looks for the highest impact per effort. WSJF asks what brings the most urgent value now.
RICE uses reach, impact, confidence, and effort. Reach means users per time period. Impact runs from 0.25 to 3. Confidence goes from 0 to 100%. Effort is in person-months.
WSJF uses business value, time criticality, and risk reduction, each scored 1-10. Divide by job size for the final score.
| RICE Framework | WSJF |
|---|---|
| Features and growth experiments | Portfolio sequencing |
| 90-day impact windows | Quarterly cost of delay |
| Team backlog decisions | Program-level planning |
RICE shines for discovery and feature bets. WSJF fits timing-driven portfolio decisions better.
The 7-step playbook
1) Choose your primary framework
We pick one framework per list to avoid double-counting. For team backlogs and sprints, we use RICE. For cross-team quarterly plans, we go with WSJF.
This choice keeps our product roadmap focused. Each framework fits a different planning need.
2) Fix one time window and anchors
Set time windows first. RICE checks 90 days of impact, WSJF covers the current quarter.
For RICE, impact scores run 0.25 to 3. Confidence gets 80% for validated ideas, 50% for directional, 25% for speculative. Effort is in person-months.
WSJF uses 1-10 scales for business value, time criticality, and risk reduction. Job size gets a 1-10 too.
3) Prep one-page briefs
Each brief hits the problem, target users, success metric, assumptions, dependencies, and data source. Keep it to one screen.
4) Score together—fast
We spend about 60-90 minutes with our core team. If debate drags past 3 minutes, we park it and pick a range. We wrap up decisions by meeting end.
5) Calculate and sort
RICE: reach × impact × confidence ÷ effort. WSJF: business value + time criticality + risk reduction, divided by job size.
Sort results from highest to lowest. The top 20% are our contenders.
6) Apply guardrails (hard gates)
We check privacy, security, accessibility, and growth practices. Items that fail don’t ship, no matter their score.
7) Decide, communicate, and set triggers
We publish winners, assumptions, delayed items, and triggers for re-scoring. Everyone stays in the loop.
Worked example: watch priorities flip
Two B2B SaaS initiatives compete for the next 90 days. We need to pick which one ships first.
Initiative A: Self-serve usage dashboards
- RICE score: (20,000 × 1.5 × 0.7) / 2 = 10,500
- WSJF score: (7+3+2)/3 = 4.0
Initiative B: Data export for enterprise deal
- RICE score: (300 × 3 × 0.8) / 1.5 = 480
- WSJF score: (6+9+5)/2 = 10.0
| Framework | Winner | Why |
|---|---|---|
| RICE | Dashboards | Higher reach drives the score |
| WSJF | Data export | Time criticality and risk reduction matter |
Opportunity scoring gives different winners, depending on what we value. RICE picks the feature for more users. WSJF picks the one that closes a strategic deal this quarter.
In our user story mapping session, dashboards served 20,000 users, but data export unlocked a major contract. If the deal is critical, we ship the export first and queue dashboards for the next sprint.
Quick calculation (drop-in)
We calculate RICE scores with a simple formula. Multiply reach by impact, then by confidence. Divide by effort for the score.
RICE Formula:
- Score = (Reach × Impact × Confidence) ÷ Effort
Example calculation:
- Reach: 10,000 users in 90 days
- Impact: 2 points
- Confidence: 0.7
- Effort: 1.5 person-months
Final rice score: (10,000 × 2 × 0.7) ÷ 1.5 = 9,333
We stick to whole numbers for scales when possible. RICE works best if we update scores every three months.
Realistic examples (B2B & B2C)
B2B regulated fintech company had just 8 weeks before a SOC2 audit. The product team had to choose: overhaul security logging, or polish the onboarding funnel?
RICE scoring favored funnel polish, touching 15,000 users for a high score. But WSJF told a different story. Logging overhaul scored TC=10 (hard deadline) and RR=9 (compliance risk).
WSJF won. We shipped the logging system to meet audit needs, then improved onboarding after.
B2C fitness app compared “workout streaks” and “coach chat” features. Streaks reached 50,000 users, 1.0 impact, 1.5 effort—strong RICE score.
Coach chat scored lower in WSJF: BV=6, TC=2, RR=2, Size=5. No urgent deadline, so RICE guided the choice. We built workout streaks and researched coach chat for later.
Inputs you’ll actually need (keep them honest)
Reach means how many users see the change. Pull real numbers from analytics or cohorts.
Impact uses five anchor levels. Attach specific metrics, like “+2 pp activation,” to show business value.
Confidence shows evidence strength. Experiments get 80%, directional data 50%, narratives 25%. This affects customer satisfaction predictions.
Effort should include design, QA, and enablement. Don’t hide the full scope.
Time Criticality means real deadlines—contracts, seasonality. “We want it soon” doesn’t count.
Risk Reduction covers security issues, platform debt, or partnership chances that add value.
Dependencies list blockers and cross-team handoffs up front.
Trade-offs you’ll face
RICE and WSJF each have their place. RICE works when you have reach and impact data, but not many hard deadlines. WSJF fits when you need to hit quarterly targets or face tight time windows.
Technical risk brings another trade-off. RICE treats platform risk as lower priority. WSJF puts more focus on risk paydown that unlocks other teams.
Cross-team work changes things too. RICE fits single-team projects. WSJF handles multi-team dependencies and sequencing better.
The story for stakeholders shifts as well. RICE gives you per-feature ROI. WSJF creates portfolio cadence and runway narratives for leadership.
Guardrails & ethics (before you rank)
We need ethical standards before building ranking systems. Privacy comes first—collect minimal data and honor deletion requests.
Security means encryption and fast patch cycles. Product managers should have clear incident playbooks ready.
We avoid manipulative growth tactics. Fair pricing and reversible settings protect users. Accessibility means following WCAG 2.1 AA standards for every interface.
Stakeholders should consider vulnerable users when ranking. Lifting metrics shouldn’t harm people who need protection most.
Pitfalls & better alternatives
Mixing frameworks in one list just confuses everyone and leads to unfair comparisons. It’s better to pick one main framework for each backlog and only use others as sanity checks.
Inconsistent time windows throw off scoring. We really need to stick to a set window—like 90 days for RICE or a quarter for WSJF—and not keep changing it.
Impact inflation creeps in when teams bump up scores over time. A good fix is to recalibrate every quarter using a couple of reference items as anchors.
Ignoring risk reduction in RICE means missing out on important work. If risk is a big factor, maybe it’s time to switch to WSJF or set up separate risk OKRs.
Treating scores as final decisions shuts out human judgment. Scores are just a tool to surface candidates—we still need to make final picks based on dependencies and strategy.
Missing revisit triggers can leave us stuck with outdated rankings. It’s smart to set clear triggers, like regulatory deadlines or cost changes, so we can re-rank fast when needed.
Mini FAQ
Can I convert RICE to WSJF or vice versa?
Not really. They answer different questions, so pick one as your main tool and use the other for a gut check.
Where should Confidence live in WSJF?
Mix uncertainty into the Business Value discussion. Call out Confidence on its own. WSJF mainly helps you sequence things when time’s tight.
How many items should we score?
Stick to the top 30–50 candidates. More than that, and the noise just drowns out the signal.
Do we need ROI or NPV too?
If you’re dealing with big investments or vendor choices, add NPV/payback. For regular backlog work, RICE/WSJF + guardrails + a decision note usually covers it.
How often do we re-score?
- Quarterly for portfolios.
- Each sprint for team backlogs.
- Sooner if some trigger pops up.