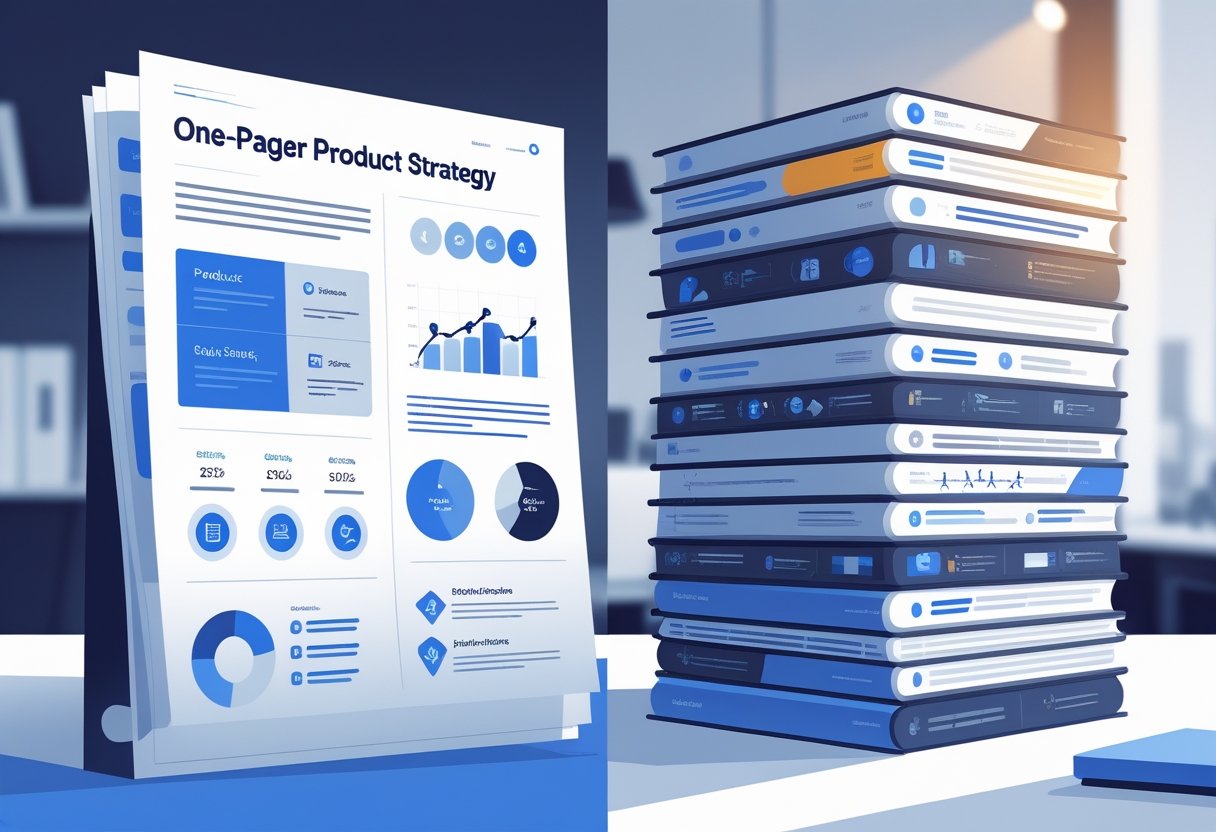
Why a one-pager (and not a slide deck)
Long strategy decks get outdated fast. People start guessing what different pieces even mean.
A one-pager forces us to focus on the most important parts of our business strategy and product vision.
We can share it with everyone, no fuss. It becomes our single source of truth for this cycle.
If we can’t fit our strategy on one page, maybe we don’t really get it yet. That’s a bit uncomfortable, but probably true.
What “good” looks like
A strong product strategy starts with clear context. We explain market changes in just a few lines.
We spot shifts in tech, customer needs, or competitors that open new doors for us.
The North Star metric becomes our main focus. We pick one outcome that signals long-term success for our product.
This metric gets a clear formula and a short why-it-matters. We add one or two guardrail metrics to keep us honest.
Customer understanding drives our goals. We list main personas and their top jobs-to-be-done.
We jot down their pain points and what they do now without us.
Our differentiation strategy highlights two or three areas where we plan to win. We also say what we won’t focus on.
This creates product differentiation that matches our business model.
The bets section lists three to five strategic product innovation efforts. Each bet gets a punchy name, value prop, outcome targets with dates, and a couple leading indicators plus one lagging metric.
These bets connect directly to our current work.
Risk management means we call out our five biggest assumptions. We name the unknowns and how we’ll test each one.
We set checkpoint dates and decision thresholds. Owners decide to continue, pivot, or kill based on clear criteria.
Dependencies and scope list cross-team requirements with named owners. We spell out what’s outside our scope right now.
Our operating model outlines review schedules, dashboards, and decision logs. We give clear ownership across PM, Engineering, Design, and Go-to-Market.
Example one-pagers
B2B fintech (SMB invoicing)
Card-network policy changes made micro-transactions pricier. Small businesses leave when payments fail and cash flow dries up.
Our North Star: Get 70% of invoices paid within 7 days by Q4. Right now, we’re at 55%.
Our Guardrails: Keep payout failures under 0.8%. Maintain gross margin above 62%.
Our product development strategy focuses on three main bets, all about speed and smart automation:
| Feature | Goal | Timeline |
|---|---|---|
| Instant Payouts Lite | 30% adoption by active SMBs | November 30 |
| Smart reminders v2 | 15-point boost in payments | Q4 |
| Risk controls | Keep failure rates low | Ongoing |
Our target market research says small businesses want faster payments. We’re teaming up with Stripe Treasury to cut payout time from two days to same day for invoices under $2,000.
The market opportunities are all about timing. Machine learning helps us send reminders through WhatsApp when customers are most likely to pay.
We’re building real-time risk scores. These catch high-risk batches before they mess things up.
This keeps failure rates low and doesn’t kill margins. We’ll check progress on October 1 with a 10% feature flag test.
By November 1, if we don’t hit 30% adoption, we’ll switch to ACH Fast Track.
Key risks include:
- Partner service levels
- Getting folks to opt into messaging
- False fraud alerts
B2C creator tool (newsletter → course)
Creators want to earn beyond sponsorships. Most course tools feel too clunky and heavy for them.
Our North Star: Help creators earn $500+ per month within 60 days of starting.
Our Guardrails: Keep refund rates under 5%. Lesson completion above 60%.
Our target audience wants simple course creation. Market trends show creators need more income streams than just ads.
Product market research highlights three key features:
- Course-from-newsletter – Turn top 20 newsletter posts into a course outline, automatically
- Checkout presets – Offer three proven price points with scarcity timers
- Student onboarding – Set up cohort starts, send reminders, and prompt community engagement
We measure success in two waves:
| Timeline | Success Metric | Pivot Option |
|---|---|---|
| Week 4 | 15% of eligible creators launch | Continue |
| Week 8 | 8% earn $500+ monthly | Switch to coaching bundles |
Our product development strategy makes course creation simple. We automate the tough stuff, like organizing content and managing students.
Bad vs. good (side-by-side)
The gap between weak and strong one-pagers jumps out when you compare them. Bad one-pagers use fuzzy language that leaves teams guessing.
| Area | Bad Approach | Good Approach |
|---|---|---|
| North Star | “Engagement” | “Weekly Active Teams = Teams with ≥3 members who created ≥1 shared artifact last 7 days” |
| Bets | “Improve onboarding; revamp UI” | “Cut time-to-first-value from 30→5 min via guided templates + sample data” |
| Risks | “Tech debt” | “Partner API daily cap 50k; if hit >40k/day by Nov 10, negotiate rate or throttle non-paying tier” |
| Checkpoints | “Quarterly review” | “Oct 15: ≥25% adoption; if <15% → kill Bet #2 and reallocate 2 squads” |
| Guardrails | none | “Crash-free sessions ≥ 99.6%; gross margin ≥ 65%” |
Good one-pagers define success with real numbers. They tell us what to measure and when to act.
This makes life easier for teams—everyone knows what matters and how to respond.
How to draft it in 90 minutes (workshop agenda)
10 min — Context dump: What’s changed? Where are we leaking value?
15 min — North Star: Pick one metric. Write the definition and formula. Add 1–2 guardrails.
25 min — Bets: Brainstorm 8–10. Force-rank to top 3–5 that move the North Star soonest.
15 min — Risks/assumptions: Top 5 unknowns plus how to test in the next 2 weeks.
15 min — Checkpoints: 2–3 calendar dates, thresholds, and who decides.
10 min — No-gos & owners: What won’t we do this cycle? Assign names.
Output: The one-pager below—copy, paste, fill.
This workshop helps the product team get a minimum viable product plan on paper. We use customer feedback to shape our choices.
The format keeps us moving forward and learning by testing, not just talking.
Copy-ready template (1–2 pages)
Start with the Product Name at the top in bold. That way, everyone knows which product we’re talking about right away.
Next, put the Product Vision just below the name. Write a single, clear sentence that sums up what the product aims to become. This vision sets the tone for all our design and feature decisions.
The Problem Statement comes after that. In two or three simple sentences, describe the main challenge users face and why it matters. Skip the jargon—keep it easy for anyone to follow.
Now, list the Target Users. Start with the primary user group, then add secondary groups underneath. Include things like job titles, company sizes, or other traits that help define who these people are.
Drop the Value Proposition right in the middle. In one sentence, explain how we solve the problem better than anyone else. This is where we show off what makes the product stand out.
Time for Key Features. Use bullet points—three to five is enough. Start each with the feature name in bold, then a quick description:
• Feature Name: Brief description of what this feature does for users
• Feature Name: Brief description of what this feature does for users
• Feature Name: Brief description of what this feature does for users
After features, move to Success Metrics. Pick three numbers that really show if we’re on track—think user growth, revenue, or engagement rates that tie back to business goals.
In the Competitive Advantage section, talk about why we’ll win. Write two or three sentences about our unique strengths. Maybe our team, technology, or market position gives us an edge.
Give Timeline its own section with key dates. Keep it simple: “Q1 2026: Feature X launches” or “March 2026: Beta testing starts.” Only include dates stakeholders actually need.
Resources Needed comes next. List what we need to make this work—team roles, budget, tools, or key partnerships. Stay high-level but give enough for planning.
End the main content with Risks and Mitigation. List the top three risks in a table:
| Risk | How We Handle It |
|---|---|
| Risk 1 description | Our plan to reduce or avoid this risk |
| Risk 2 description | Our plan to reduce or avoid this risk |
| Risk 3 description | Our plan to reduce or avoid this risk |
Wrap up with contact info. Add the product manager’s name, email, and the last update date.
Stick with consistent fonts and spacing. Black text on white keeps it readable. Use bold for section headers and bullets to keep things from blending together.
Keep the whole template to one page if you can. If you need more space, try shrinking the font or tightening spacing before you spill onto a second page.
Make it run the org (practical tips)
Write action-focused metrics with verbs that show clear outcomes. Instead of vague project names, set targets like “reduce signup time to 3 minutes.”
Set decision deadlines that tie to real business goals. Teams need rules like “if user retention hits 80% by December, we expand the feature.” That gives everyone clear checkpoints.
Track KPIs before starting work. You’ve got to measure things before you can manage them. Product management just doesn’t work blind.
Document what we won’t do. Publish the no-go list. It keeps zombie projects away and helps get buy-in. Boundaries matter—otherwise, requests never end.
Connect daily work to strategic planning. Every sprint should link back to the main business goals. Anything else? Make it the exception, not the rule.
Review monthly without fail. Markets move fast. Update the plan every month, no matter what.
From one-pager to roadmap (clean handoff)
Build the roadmap with a Now/Next/Later structure. This connects straight to our Bet IDs.
Each roadmap item needs to show three things: Bet ID → expected impact → leading metric.
flowchart LR
    NS[North Star] --> B1[Bet 1]
    NS --> B2[Bet 2]
    NS --> B3[Bet 3]
    B1 --> N[Now]
    B2 --> X[Next]
    B3 --> L[Later]
    classDef node fill:#f8fafc,stroke:#94a3b8,rx:14;
    class NS,B1,B2,B3,N,X,L node;
This setup makes it easy to trace each roadmap item back to a specific bet. If we find items with no connection to a bet, we seriously consider cutting them.
The handoff feels clean when teams see exactly which bets drive their priorities. No confusion—just clarity.
Frequently Asked Questions
How many bets should we make?
Three to five bets is the sweet spot. More than that, and resources get stretched thin. Fewer, and we miss out on learning and new opportunities.
What should we do if our North Star conflicts with revenue?
Add revenue as a guardrail—don’t swap out your North Star. This keeps us focused on user value, not just chasing quick cash. Chasing short-term money can hurt the product’s long-term health and market share.
Should we use quarterly cycles or longer periods?
Usually, stick with quarterly cycles. For big platform rebuilds or regulated industries, go for semester-long cycles. This timing helps us adapt to market shifts better.
What happens if a bet clearly fails before the cycle ends?
Use the decision rule to stop it early. Move resources to better bets. Always document what you learned in the decision log for the next SWOT analysis.
Front matter
A product strategy one-pager guides teams and stakeholders. The best ones answer three questions: what are we building, who’s it for, and how will we measure success?
Key elements make the difference between a useful doc and one that gets ignored. Clear objectives set the direction. Knowing the target audience keeps us focused. Measurable outcomes let us track progress.
The framework tries to balance detail and clarity. Visual elements like charts and diagrams help get complex ideas across fast.
| Component | Purpose | Time Investment |
|---|---|---|
| Problem Statement | Define the challenge | 20% |
| Target Audience | Identify users | 15% |
| Solution Overview | Outline approach | 25% |
| Success Metrics | Set measurements | 20% |
| Timeline | Plan execution | 20% |
Common mistakes can kill the document’s usefulness. If you cram in too much, it just confuses people. Jargon makes it unreadable. Write in plain language so everyone gets it.
The best one-pagers actually guide decisions—not just collect digital dust. Test yours by having a teammate make decisions using only the info inside.
Effective one-pagers don’t happen on the first try. It usually takes a few drafts and team feedback before it really resonates with everyone involved.
External references (for further reading)
Marty Cagan’s Inspired and Empowered dig into product vision and strategy. These books give teams a real shot at building stronger strategies—honestly, they’re almost essential reads.
Melissa Perri’s Escaping the Build Trap lays out the differences between strategy and roadmap thinking. It’s pretty eye-opening for any product team that’s ever felt stuck in the weeds.
Lean Analytics dives into picking the right metrics, like North Star metrics and guardrails. If you’re unsure what to measure, this one’s got your back.