In B2B, you’ve got lots of stakeholders hiring your product for their own reasons. Economic buyers, champions, technical evaluators, admins, end users, procurement, and security teams all want different things.
Map four job types for every stakeholder: functional, emotional, social, and buying jobs. Use the “When… I want to… so I can…” format for clear job statements.
Define outcome metrics with direction, unit, and context. Score opportunities by multiplying importance and dissatisfaction.
Connect each job to specific product or go-to-market decisions.
Avoid these common mistakes:
- Making up personas instead of finding real insights
- Building feature wishlists without understanding jobs
- Writing generic job descriptions
- Ignoring buying and implementation processes
Why B2B JTBD is different
B2B innovation means mapping multiple stakeholders, not just one person. You’ve got to focus on the whole account’s progress.
In B2B, several decision-makers share purchase risk. Each has their own job to be done that affects the outcome.
The job types you need (for each stakeholder)
Map four distinct customer jobs for each stakeholder. Functional jobs solve practical tasks.
Emotional jobs focus on feelings like confidence and control. Social jobs matter—people care how they look to their peers.
Buying and consumption-chain jobs cover vendor selection, security approval, integration, training, and budget planning. If you skip these, you might win users but lose the deal.
A simple, repeatable process (6 steps)
1) Pick the deal archetype and unit of analysis
Start by clearly defining your target segment. Maybe that’s mid-market SaaS companies with 200-2,000 employees.
Map out the typical stakeholder set: buyers, champions, technical evaluators, end users, procurement, and security teams.
2) Build the stakeholder lattice
List real job titles, not vague personas. For example, VP Data as the economic buyer and Head of Analytics as the champion.
Identify technical evaluators like Staff Data Engineers and end users like Analysts and Product Managers. Risk and compliance includes Security and Legal; commercial covers Procurement and Finance.
3) Elicit jobs with structured prompts
Use the job statement format: When (context/trigger), I want to (progress action), so I can (desired outcome).
For example: “When compliance asks for an audit trail, I want to export immutable logs so I can pass the review without engineering help.” This helps capture real stakeholder needs.
4) Add outcomes & metrics
Turn jobs into outcome statements using direction, unit, and context.
For instance, reduce time-to-first-insight from 2 days to 2 hours for new analysts. Or, increase the percentage of queries under 2 seconds during peak hours.
5) Score opportunity (fast, not fussy)
Multiply Importance (1-5) by Dissatisfaction (1-5) for an Opportunity score (1-25).
Keep only the top 5-8 jobs per account, and move the rest to the parking lot.
6) Trace jobs to decisions
Connect every high-opportunity job to specific decisions in Product, Pricing/packaging, GTM, or Post-sale activities.
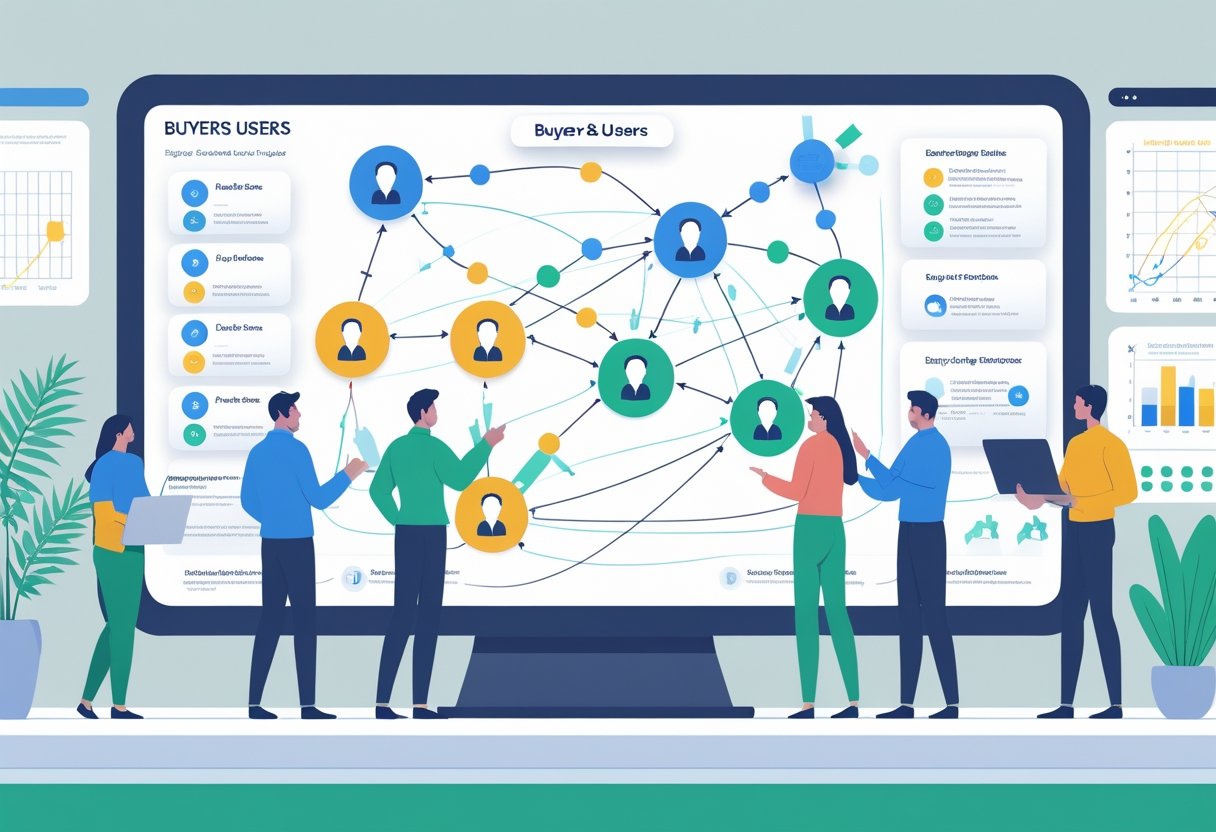
Visual: one-page stakeholder → job map
Picture a stakeholder map showing seven key roles in a mid-market analytics buying decision. Each one connects to the core job: producing trustworthy product insights faster.
Economic Buyer (VP Data) drives budget and narrative. Champion (Head of Analytics) focuses on internal adoption and credibility.
Technical Evaluator (Staff Data Engineer) handles integration and reliability. Platform Admin manages governance and operations.
End Users (Analysts) create and share insights. Security/Compliance ensures risk controls.
Procurement/Finance checks commercial fit.
All these roles feed into the central job outcome through their unique contributions. This visual makes it easier to see how each role shapes the buying process—and what they care about most.
Worked example (mid-market analytics platform)
Our B2B SaaS analytics platform serves lots of stakeholders with different needs. The VP Data cares about forecast accuracy for quarterly business reviews. They want a forecast MAPE of 6% or less to secure budget approvals. We rolled out versioned models, dashboard trust badges, and executive-ready PDF reports for them.
The Head of Analytics pushes our platform internally. They want new teams to reach first insight within a week. We cut their time to first insight from 5 days to 2. Our solution? Sample data, project templates, and a guided first project flow.
Key stakeholder requirements:
- Staff Data Engineers: deterministic schema handling to prevent pipeline failures
- Platform Admins: least-privilege roles for audit compliance
- Analysts: query speeds under 2 seconds for real-time exploration
- Security teams: one-click compliance reports within 48-hour SLAs
Our product development roadmap addresses these pain points. We ship guided project templates and schema contracts first. These features tackle the highest opportunity scores from our stakeholder analysis.
Market opportunities show up when procurement teams want predictable costs. They want budget variance under 10% compared to planned spending. So, we add usage caps, budget alerts, and tier fences to our pricing model.
The decision maker is usually the VP Data. They control the budget and look at vendor proposals. Our go-to-market strategy includes QBR forecast accuracy proof points and security evidence packs.
Post-sale success hinges on smooth onboarding. We build RBAC presets and audit exports into our implementation process. This cuts time to provision new users and stops escalations during setup.
Interview guide (10 questions you can reuse)
These ten questions dig into customer pain points during buying decisions. Use them in interviews or surveys to get real stories.
Start with recent experiences:
- Walk me through the last time you evaluated or switched tools.
- What trigger started that process? Who got involved next?
Learn about decision criteria:
- What were the top two outcomes you needed early to feel confident?
- What made the short list and why? What nearly knocked a vendor out?
Understand risks and problems:
- Describe a risk that could stall or kill a deal.
- After you picked, what went wrong in the first 30 days?
Find hidden value drivers:
- What is hard to measure but clearly matters to you?
- What evidence would convince your leadership quickly?
Discover improvement opportunities:
- If you had a magic wand, what would be faster or safer?
- What do you not care about that vendors always pitch?
Pro tip: Ask for artifacts like onboarding docs, security requests, or QBR decks. Real jobs hide in these documents.
Anti-patterns (and what to do instead)
Teams fall into some classic traps when mapping customer jobs. Persona theater gives you shiny customer profiles but no real triggers or outcomes. Use job statements tied to actual events instead.
Feature wishlists sneak in as customer jobs. Ban solution words from job descriptions—add features later in implications.
Generic jobs like “get insights” don’t help anyone. Add thresholds, units, and situations so jobs are actionable for your marketing strategy.
Single-stakeholder maps hurt customer acquisition in complex deals. Bring in buyer, technical, admin, security, and procurement jobs to boost conversion rates.
Don’t ignore buying and implementation jobs around security, pricing, and training. Include consumption-chain jobs to improve customer experience and efficiency.
Over-precision scoring from tiny samples will mislead you. Stick to 1-5 scales and revisit quarterly with more data. This helps your CRM system track real progress against competitors.
Lightweight templates (copy and use)
Here are simple templates to capture and organize customer insights fast. Both formats work for different research and analysis stages.
JTBD capture sheet (columns)
This spreadsheet tracks all the key details in one spot. Each row is one job from a specific stakeholder.
| Account segment | Stakeholder (title) | Job statement (When/I want/So I can) |
|---|---|---|
| Outcome metric (direction + unit + context) | Importance 1–5 | Dissatisfaction 1–5 |
| Opportunity score (IxD) | Evidence (quote/link) | Implications (product/pricing/GTM/post-sale) |
| Owner | Status |
One-slide summary per account
This format is great for sharing findings with teams. It all fits on one page.
Root outcome for account (e.g., “Trustworthy insights faster”)
Top 5 jobs (with outcome metrics + scores)
Decisions: Product | Pricing | GTM | Post-sale
Risks & assumptions
Next interview targets
How to keep the map alive
We update our map monthly with new interviews and telemetry data. We track outcomes like TTFI, p95 latency, and audit turnaround times.
During reviews, we show two funded jobs leading to decisions and early signals. We also share what we’re not pursuing, just to keep it honest.
Final take
JTBD in B2B isn’t about crafting fancy statements. It’s about making clear trade-offs that actually help people get stuff done.
We map jobs across stakeholders. Then we quantify outcomes and let those jobs guide features, pricing, and proof—because that’s what really matters in the end.