TL;DR
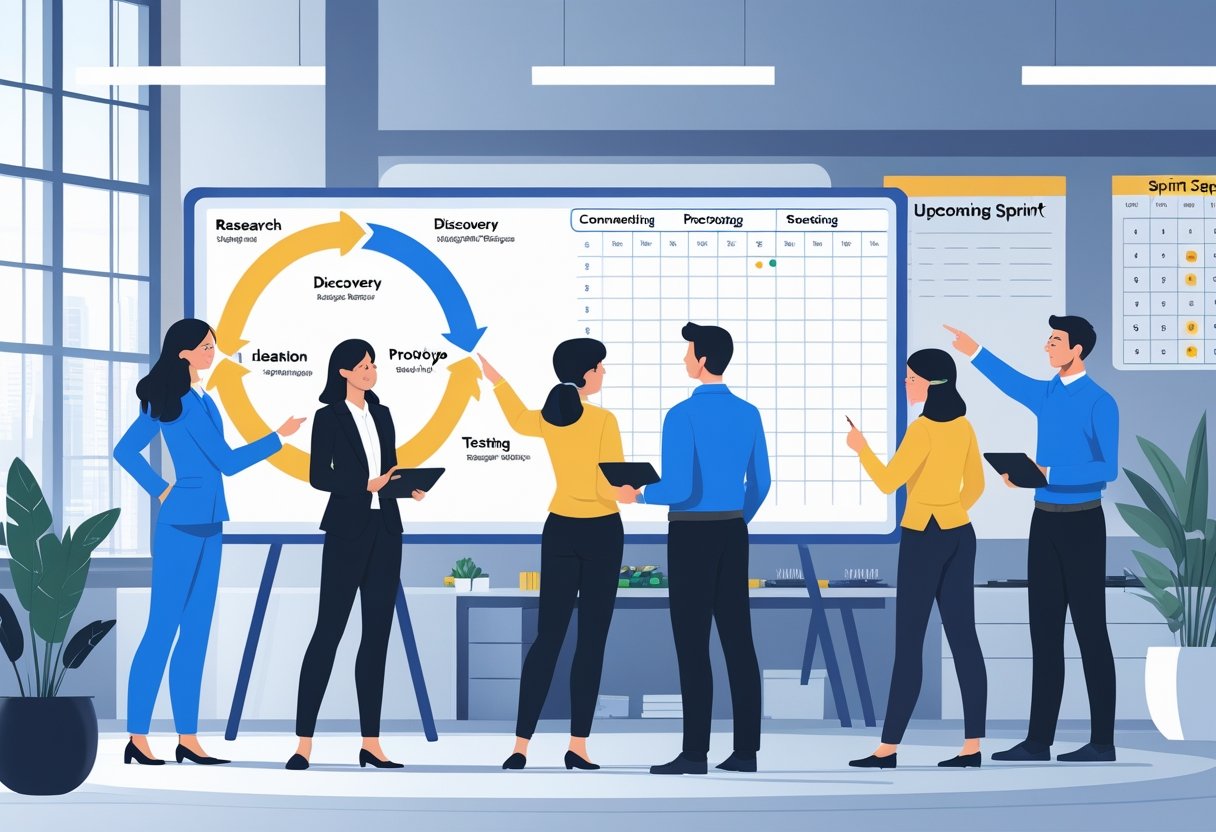
A discovery loop runs for a week. Teams turn questions into decisions by running 3-5 interviews and building a quick prototype, usually in about an hour or two.
Every Friday, we decide what to do next based on what we learned, tying it all to a specific metric. We keep things simple: just a problem brief, interview notes, a prototype link, and a decision log.
We use RICE scoring to pick which questions to tackle first. We stick to basics—get user consent, make things accessible, and don’t use dark patterns.
We repeat this loop every week. Then we share our results openly so other teams and execs can see how our choices connect to real evidence.
Key terms (one-line definitions)
Discovery loop – A one-week cycle we repeat to test assumptions before building features.
Problem interview – A 20-30 minute call to confirm customer pains and current solutions.
Solution interview – A guided walkthrough with prototypes to test customer behavior and value.
Quick prototype – A simple mock or clickable flow for realistic feedback during research.
Decision log – A one-page record of our choices, reasons, and what we’ll monitor next.
Success metric – The main indicator we expect to improve if our discovery approach works.
Guardrails – Limits we set to avoid problems with privacy, access, quality, or costs.
Why a weekly cadence works
Weekly discovery puts a timer on our work. It keeps us focused and close to real problems.
We make smaller, faster bets and tie our choices to actual numbers, not just opinions.
In three months, we run 10-12 loops. That builds a strong evidence trail for planning reviews.
The one-week playbook
A discovery sprint works best with a clear daily structure. Each day has its own focus and time box.
Monday — frame the question (45–60 min)
Start with a problem brief. Write who faces the problem, what triggers it, the desired outcome, and key assumptions.
Pick a success metric and a guardrail. Example: “Activation +3 pts; support tickets no worse than baseline.”
Draft a RICE score for your ideas. Pick one to test this week.
Tuesday — run problem interviews (2–3 people)
Recruit from recent signups or active customers. Focus on people who’ve faced the problem recently.
Ask about the last time they hit this issue. Capture quotes, timestamps, and artifacts like screenshots or emails.
Wrap up by confirming priority and constraints—security, budget, or integration needs.
Wednesday — prototype (1–2 hours)
Build a clickable happy path only. Don’t worry about edge cases yet.
Add simple tracking if you can. Count clicks and time on each step.
Prep a 5-question script: task, expect, do, feel, value.
Thursday — solution interviews (2–3 people)
Show the prototype and let users drive. Keep sessions to 25 minutes.
Measure task completion, confusion, and willingness to try or buy.
Note down quotes that would convince your execs.
Friday — decide and publish (30–45 min)
Fill out the decision log with outcome, evidence, your go/no-go, and the next metric to watch.
Share a 1-pager in Slack or Notion. Link the brief, notes, prototype, and decision.
If you’re moving forward, create a small delivery slice for 1–2 weeks tied to the same success metric.
Trade-offs you’ll face (quick table)
| Choice | When to choose | Pros | Cons |
|---|---|---|---|
| Problem interviews | Early, when you’re unsure about pains/triggers | Rich context; finds constraints | No design validation |
| Solution interviews | You have a candidate flow | Tests behavior and value fast | Small sample; not real data |
| Low-fi prototype | Early concept, many unknowns | Fast, disposable, low effort | Misses edge cases |
| High-fi prototype | Usability risk is high | Realistic, stakeholder-friendly | Slower; risk of over-investing |
| Unmoderated test | Simple tasks, large top-funnel | Scales; quick quant | Less depth; recruitment bias |
| Live AB | Confident on safety & tracking | Real behavior, real metrics | Takes eng time; guardrails needed |
Every research method comes with its own trade-offs. Timing matters a lot. Early methods give broad insights but miss details, while later ones offer more realism and need more resources.
B2B example (analytics SaaS)
We tried a simple innovation to help new developers get started faster. Our team wanted to reduce time-to-first-value by adding a “Copy cURL” button with sample data.
We measured success through activation rate—developers who run more than one API call in 24 hours. We also kept an eye on p95 latency as a guardrail.
Our 4-day process:
- Tuesday: We talked to 3 developers. They struggled with schema confusion and auth friction.
- Wednesday: We built a Figma prototype with the copy button, schema helper, and a fake API key.
- Thursday: We ran 3 walkthroughs. Two finished in under 5 minutes. One asked for language tabs.
- Friday: We decided to build it as a 1-week project.
We used RICE scoring to compare options:
| Factor | Value |
|---|---|
| Reach | 4,800 users |
| Impact | +0.2 |
| Confidence | 0.7 |
| Effort | 1 week |
| RICE Score | 672 |
This idea scored higher than two others, which got 420 and 300. We added language tabs based on user feedback.
B2C example (habit app)
We tested a starter streak feature for our habit tracking app. Our goal: boost Day-7 retention through a simple onboarding flow.
Problem discovery: New users felt overwhelmed by too many habit choices on day one. Four interviews revealed this as a key barrier.
Quick prototype: We made a low-fi version with one prebuilt 7-day path and daily push reminders. That helped reduce decision fatigue.
Solution testing: Three user walkthroughs looked promising. All users finished their first task. One person wanted SMS reminders instead of push.
Key metrics:
- Primary: Day-7 active rate
- Guardrails: Opt-out rate and push complaints
We went ahead with push-only reminders first. SMS options are in phase two. We added clear frequency controls and one-tap unsubscribe to protect user experience.
Guardrails and ethics
We always get consent from participants before testing. Tell them what we’re testing and how we’ll use the notes.
No dark patterns in our designs. We avoid misleading copy or forced choices.
Our accessibility basics:
- Keyboard navigation support
- Readable text sizes
- Reduced motion options
- High contrast modes
We strip personal info from all test materials. Recordings go in secure locations with limited access for stakeholders.
For live tests, we set clear limits—budget caps, rate limits, and always a rollback plan.
Copy-ready assets
Teams need structured tools to guide their prototyping work. These assets help us stay organized during research and testing.
A) Problem brief (fill-in)
Problem brief — < Name > | Owner: < PM > | Date: < YYYY-MM-DD >
- Target segment:
- Trigger / “last time”:
- Desired outcome (user):
- Business outcome (metric + target + date):
- Key assumptions (top 3):
- Risks & guardrails:
- Links: research repo | dashboards | prior decisions
B) Interview note sheet
Participant: < role, company/segment > | Date:
| Field | Notes |
|---|---|
| Context (last time): | |
| Steps they took: | |
| Workarounds/tools: | |
| Pains & constraints: | |
| Definition of success: | |
| Open questions: |
C) Prototype test script (25 min)
- Setup (1 min): Let users know we test the design, not them
- Task (10 min): Ask them to complete their goal as they normally would
- Observe: Track time, errors, and questions
- Value probe (5 min): Ask what this would replace for them
- Close (2 min): Find out what’s missing
D) Decision log (one page)
Decision: < Go / No-Go / Pivot > | Date:
- Problem & user segment:
- Evidence summary: < 3 bullets >
- Expected impact: < metric + timeframe >
- Scope & constraints:
- Next checkpoint:
- Owner(s) & communication plan:
Common pitfalls and better alternatives
Teams love to test too many ideas at once. That just muddies the results and wastes time.
Stick to one hypothesis and a single success metric for each testing loop.
Lots of teams only test the happy path. But real users hit snags all the time.
Add one realistic edge case—maybe an error state or an empty screen—into your test runs.
If you ask, “Do you like it?” you’ll rarely get anything useful. Try, “What would you do next?” and actually watch what people do with your prototype.
Pixel-perfect designs too early? That’s a trap. Start with low-fi prototypes and only polish things once users give you a clear thumbs-up.
Keep a decision log instead of letting choices vanish in endless chat threads. Link that log to your roadmap so everyone can see what got decided and why.
Mini FAQ
How many interviews do we need? Three to five interviews per loop usually surface patterns. If answers don’t line up, we just keep going.
Do we need analytics first? Nope. We always start with interviews. Tracking comes in before we ship the delivery slice.
What if stakeholders want numbers? We’ll use a quick RICE and a leading metric forecast. No need to get too precise—round those numbers.
Can we run loops in sprints? Absolutely. We carve out 10–20% of team time for discovery. Set a timebox, then share whatever you learned on Friday.
What if our results are mixed? We still write up the decision. We pick a path, set the next checkpoint, and figure out what would make us rethink things.
Front matter (YAML)
YAML front matter sits at the top of markdown files. It tells us key details about the content.
We use three dashes to mark the start and end of this section.
Basic structure:
---
title: "Discovery Loops You'll Actually Run Next Sprint"
date: 2025-08-29
author: "Product Team"
tags: ["product discovery", "agile", "user research"]
---
We can include several key fields in our YAML front matter:
| Field | Purpose | Example |
|---|---|---|
| title | Page or post title | “Discovery Loops You’ll Actually Run Next Sprint” |
| date | Publication date | 2025-08-29 |
| author | Content creator | “Product Team” |
| description | Brief summary | “Practical discovery methods for agile teams” |
| tags | Topic keywords | [“research”, “discovery”, “sprint”] |
Common fields we use:
- slug: URL-friendly version of the title
- category: Main topic area
- draft: Set to true to hide unpublished content
- featured_image: Hero image for the post
For simple text, we skip the quotes. But if a value has special characters or gets complicated, we wrap it in quotes.
Boolean values:
published: true
featured: false
comments_enabled: true
Lists in YAML:
tags:
  - product discovery
  - user research
  - sprint planning
You can also write lists on one line with square brackets, like [tag1, tag2, tag3].


