TL;DR
We use a weighted scorecard to pick between buy, build, or partner options. The scorecard covers seven criteria: time-to-value, TCO, differentiation, integration risk, compliance/security, lock-in, and team fit.
We run 3-year NPV calculations for costs and check payback when revenue or savings are in play. All our assumptions get documented, no hiding the logic.
Decisions use pre-agreed weights and clear decision rules. We add exit triggers to help manage lock-in risks.
Guardrails? Absolutely: privacy by design, accessibility, non-manipulative UX, data residency, vendor DPAs, and reversible integration patterns.
We use the CSV matrix below to score each option and keep our process transparent and auditable.
Definitions (one-liners)
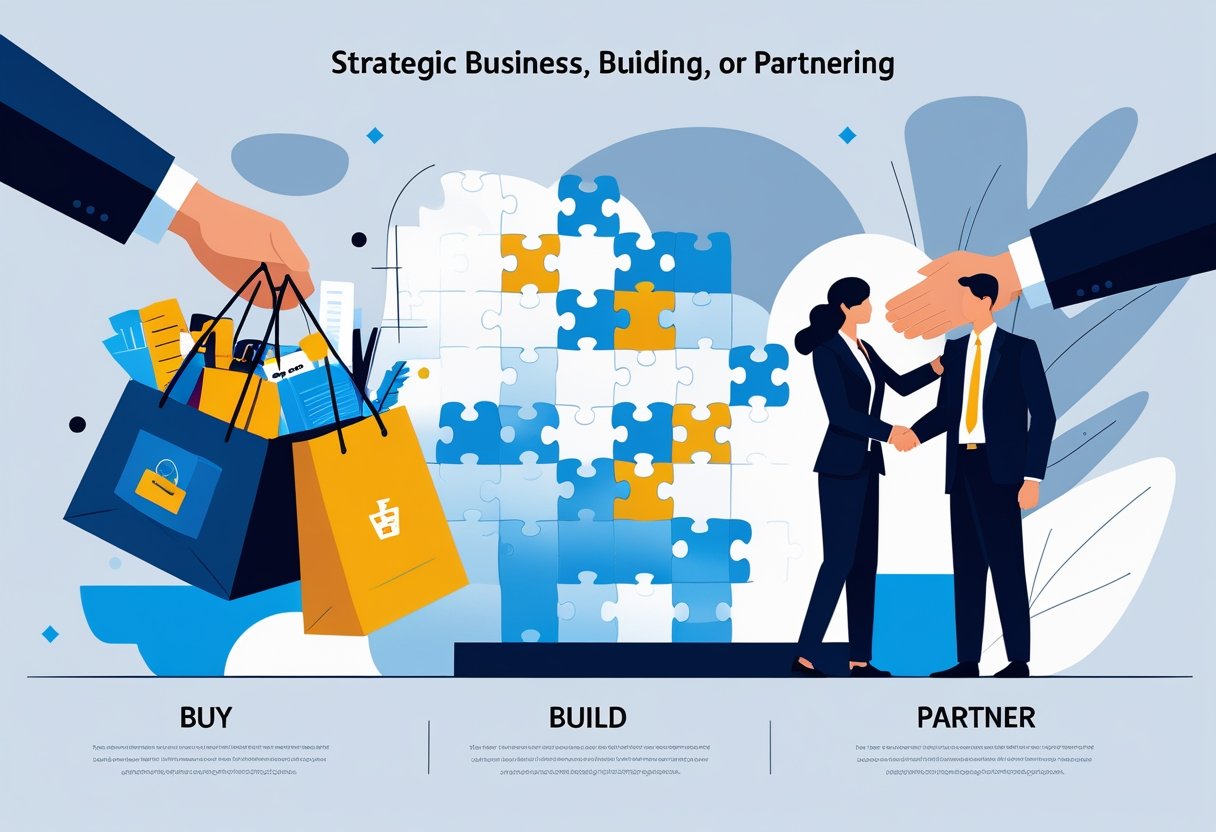
Buy means we use a third-party product or API and plug it into our systems.
Build means we create and run the capability ourselves, owning the roadmap and IP.
Partner means we co-develop or resell with a strategic vendor, sharing both delivery and risk.
TCO (Total Cost of Ownership) is every cost to build, run, maintain, scale, and stay compliant.
NPV (Net Present Value) is the discounted sum of future cash flows over a set period—say, three years at ten percent.
The scorecard (what actually matters)
We rate each option 1 to 5 across seven factors. Each factor gets a weight, and all weights total 100.
Time-to-value is how quickly users see benefits. TCO is the full 3-year cost to build and run it.
Differentiation asks if this gives us an edge. Integration risk is about how many systems we touch and what could go wrong.
Compliance and security checks data handling, residency, and audit needs. Lock-in and exit weighs switching costs and contract flexibility.
Team fit is about our skills, hiring, and what we give up by picking this route.
We go with the highest weighted score that clears our guardrails and beats the runner-up by 10% or more. If the gap is tighter, we run a 2-3 day risk check first. This works for partnerships and joint ventures too.
Step-by-step playbook
1) Frame the outcome
We start by deciding which KPI this decision will impact. Maybe it’s our North Star metric or a key growth driver.
We focus on must-have capabilities. “Nice-to-haves” just muddy the waters.
We write down our constraints right away. Budget, deadlines, compliance, and data residency all shape our choices.
2) Enumerate options
We kick off with three base choices: buy, build, or partner. Each one fits different strategic needs.
We add realistic variants. For buying, that means comparing real vendors. For building, we look at different tech approaches.
3) Set weights (strategy first)
We split 100 points across seven criteria, based on our strategy. For example, a regulated B2B SaaS might put 20 points each on time-to-value, total cost, and differentiation.
Building usually scores higher for differentiation, lower for time-to-value. We tweak weights based on what matters most to us.
4) Estimate each criterion
We write our assumptions in plain English. If something feels off later, it’s easy to spot.
We use ranges when we’re not sure. Fake precision is just misleading.
For costs, we run a 3-year NPV to compare apples to apples.
5) Score and total
We multiply each weight by its score, then sum it all up for the weighted score.
We double-check the math with payback months if cash flow is involved.
6) Guardrails (must pass)
Every option has to clear our guardrails. Privacy and security mean DPA agreements and SOC2 proof.
User-facing stuff needs WCAG 2.1 AA compliance. No dark patterns, and consent flows have to be clear.
We plan an exit strategy. Data export and API abstraction help protect us from vendor lock-in.
7) Decide, log, and checkpoint
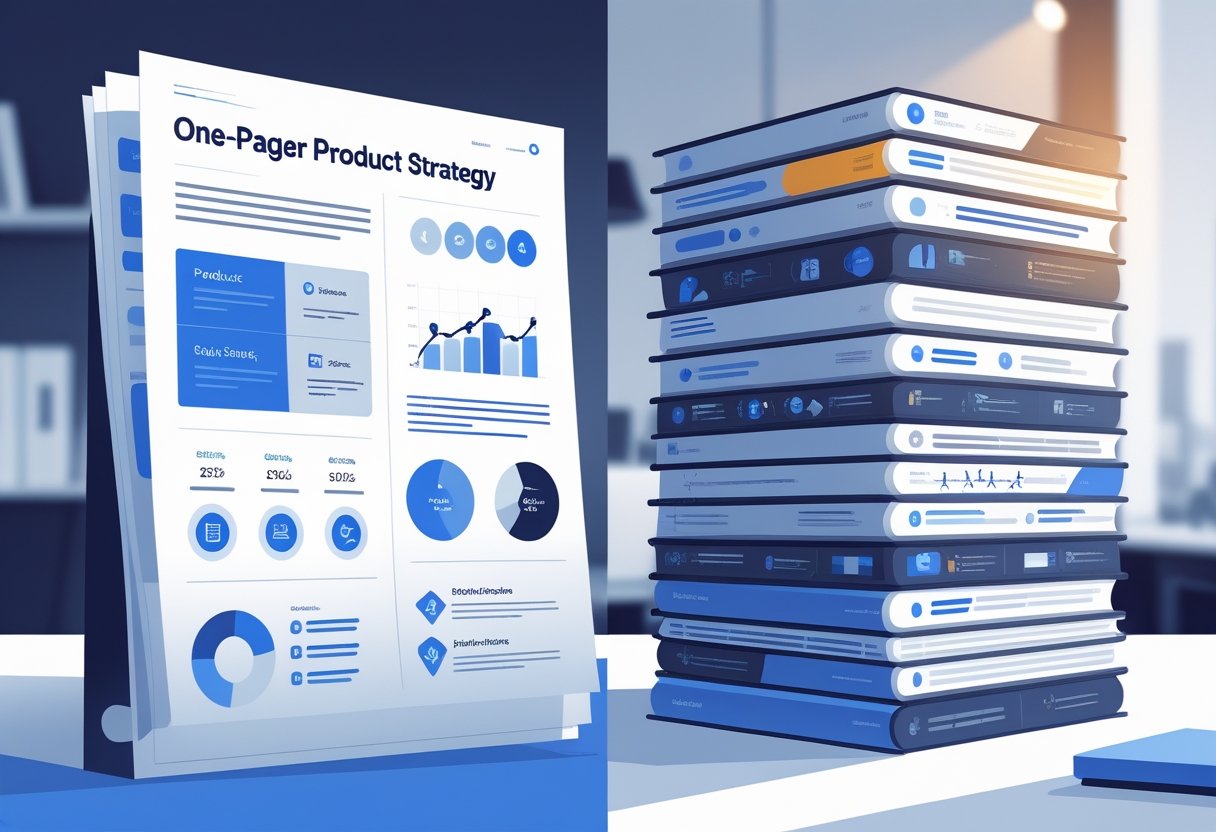
We publish a one-page decision memo. It covers context, options, scorecard, and our final pick.
We revisit the decision in 6-12 months. If prices spike or SLAs get missed, we review sooner.
Trade-offs at a glance
Each approach has its own perks, depending on your situation and time-to-market needs.
| Option | Pros | Cons | Best when |
|---|---|---|---|
| Buy | Fast time-to-value, proven features, shared maintenance | License costs, vendor lock-in risk, limited influence | Non-core features under time pressure |
| Build | Full control, intellectual property ownership, differentiation | Slower delivery, higher upfront and ongoing costs | Core to strategy and competitive advantage |
| Partner | Shared risk, market distribution, domain expertise | Coordination overhead, split control | New markets or complex domains we can’t staff quickly |
Market conditions really shape which path fits your needs and timeline.
Worked example (B2B): KYC/AML for a fintech SaaS
A fintech SaaS company needs identity verification to sell to banks. Their customer base demands strict compliance checks before any deal moves forward.
Three options: buy a KYC API, build an internal service, or partner with a regtech company.
We calculated total cost of ownership over three years at a 10% discount rate. Buy costs $413k total: $40k integration up front, $150k per year. Build takes $400k to develop, plus $200k maintenance yearly, totaling $897k. Partner requires $80k setup, $180k per year, adding up to $528k.
We scored each option on seven criteria, using business-priority weights:
| Criteria (weight) | Buy | Build | Partner |
|---|---|---|---|
| TTV (20) | 5 | 2 | 4 |
| TCO (20) | 4 | 2 | 3 |
| Differentiation (20) | 2 | 3 | 3 |
| Integration (10) | 3 | 4 | 3 |
| Compliance (15) | 5 | 3 | 4 |
| Lock-in (10) | 2 | 5 | 3 |
| Team fit (5) | 4 | 3 | 4 |
| Weighted total | 365 | 310 | 340 |
Buying wins at 365 points. It leads on time-to-value, cost, and compliance.
We went with the buy route, but we protected ourselves against lock-in. That means abstraction layers, data export rights, and price-cap clauses. We set exit triggers—if annual costs go above $220k or uptime dips below 99.9% twice per quarter, we revisit.
Worked example (B2C): AI background removal in a photo app
A photo app wants to add AI background removal to boost paid conversions. Their choices: buy an API, build a custom model, or partner with a creative suite.
Buy Option Analysis:
- Expected revenue bump: $12k/month
- API costs: $0.02 per image × 200k images = $4k/month
- Integration: $30k one-time
- Payback period: 3.75 months
Here’s the math: 30,000 ÷ (12,000 − 4,000) = 3.75 months.
Risk Assessment: If API pricing jumps to $0.03 per image, monthly costs hit $6k. Payback stretches to 5 months, but that’s still reasonable.
Decision Framework: Start by buying for quick launch. Watch usage and costs closely. If volume goes over 300k images monthly and API costs beat in-house by 25% or more over a year, consider building.
How to compute NPV and payback (formulas)
NPV calculation uses this formula: NPV = C₀ + Σ(C_t / (1 + r)^t). C₀ is Year 0 cost, r is discount rate (like 10%), and t runs from 1 to 3 years.
Payback calculation is: Payback = Up-front cost / (Monthly benefit − Monthly COGS). We only use payback when a feature clearly drives revenue or savings.
B2B and B2C examples (one-paragraph each)
B2B SaaS Analytics Platform
We need audit-trail exports for our analytics platform. The Buy option delivers in four weeks and meets SOC2 compliance. Building would take three months, plus the headache of ongoing maintenance. Our scorecard tips toward Buy for speed and compliance. We add exit clauses if vendor pricing jumps 30% or export performance drops below what we agreed to.
B2C Fitness Application
We want live coach chat for our fitness app users. Partnering gives us co-marketing chances and pre-vetted coaches, though we lose some control. Buying a solution moves faster but costs more per chat session. The scorecard leans toward Partner for user reach and distribution. We add contract terms for data portability and require chat interfaces that everyone can use.
Implementation details (so you can ship this decision)
Copy the anchors for scoring
TTV: 1 = 3–6 months; 3 = 1–2 months; 5 = ≤4 weeks.
Integration risk: 1 = 6+ systems, data migration; 3 = 3–5 systems; 5 = ≤2 systems, no migration.
Lock-in: 1 = proprietary data + multi-year contract; 3 = export API; 5 = open formats + 12-month term.
Where teams slip—and quick fixes
Double-counting risk. Keep criteria distinct; cap at seven.
Ignoring opportunity cost. Add a line: “What won’t we ship if we build?”
Maintenance blind spot. Budget 10–20% of build cost/year for upkeep and audits.
No exit plan. Document export, price-cap, SLA credits, and shadow integration.
False precision. Use ranges and decide on order-of-magnitude differences, not decimals.
Guardrails & ethics (apply to all three paths)
Privacy and security form our foundation. We minimize data collection and use encryption for every transfer and storage. Role-based access controls decide who sees what.
Compliance matters for venture capital deals. We follow data protection laws and use standard contractual clauses. Audit logs track all system access.
Fair design means transparent pricing and clear consent options. We avoid dark patterns that trick users.
Accessibility requires WCAG 2.1 AA standards for every interface. This covers partner widgets and embedded tools too.
Mini FAQ
How do we set weights objectively?
We tie weights to our strategy and stage. If we’re regulated or enterprise-heavy, we bump up Compliance and TTV. If we’re all about platform plays, we focus on Differentiation.
When does Partner beat Buy?
Partner wins when distribution or domain credibility is the bottleneck, not features. You see this with OEM deals, co-sell arrangements, or joint solutions in new markets.
What discount rate should we use for NPV?
We use our finance hurdle rate, usually 8–15%. We keep it consistent across all options.
Should we use RICE or WSJF here?
We use RICE (Reach, Impact, Confidence, Effort) to sequence experiments. We use this scorecard to choose ownership model. They’re for different jobs.
How do we manage lock-in risk?
We negotiate export rights, price caps, and SLA credits. We build an abstraction layer and set exit triggers for price, SLA, or roadmap changes.
Downloadable matrix (CSV)
We’ve got a CSV matrix template for make-versus-buy calls. The matrix uses seven criteria with weights that add up to 100.
Each option gets a score from 1 to 5 for every criterion. Time-to-value, TCO, and differentiation each get a 20% weight. Compliance and security make up 15% of the total.
The template includes rows for weighted totals and decision rules. We require at least a 10% margin between options, plus passing all guardrails.
You can add assumptions, exit triggers, and notes right in the spreadsheet. The format works with Excel, Google Sheets, and other programs.
One-page decision memo (structure to copy)
Next steps & owner (dates, milestones)
Context & goal (1–2 lines)
Options considered (Buy/Build/Partner)
Scorecard (table + totals)
TCO summary (3-year NPV + assumptions)
Guardrails (privacy, accessibility, compliance)
Decision & rationale (2–4 bullets)
Exit plan & triggers (quantified)
